Read your results
Downloading PDF, Excel & charts
Where to find and download the report PDF, the Excel model, and the charts.
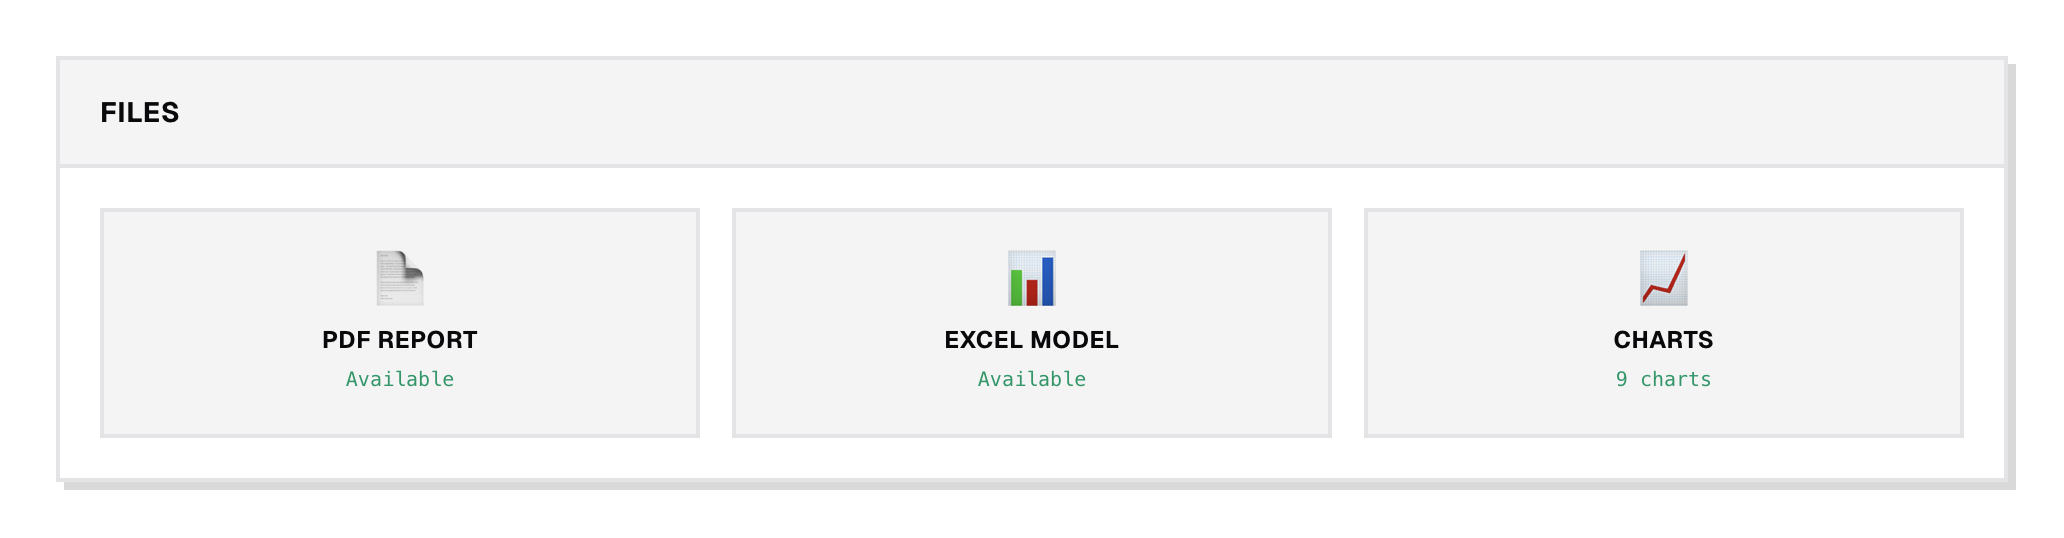
Every finished report comes with files you can download: the report as a PDF, the valuation model as an Excel workbook, and the charts. They're in the Files card on the report page.
The PDF report
The PDF is the full write-up with the charts and tables built in, the version to hand to someone who isn't in dbot. To share the live report instead, see Sharing reports.
The Excel model
The Excel workbook is the actual model: a Ginzu-style DCF spreadsheet, or Damodaran's divginzu dividend-discount workbook for DDM reports, filled in with dbot's final inputs. Open it to trace the math and push on the assumptions yourself. Change a growth rate or a margin and watch the value move.
The charts
You can also download the chart images on their own: the valuation bridge, the cash-flow or dividend projection, the peer comparison, and the sensitivity heatmap.
Download links are private and expire
Your reports are private to your account. Each button creates a fresh, signed link that stops working after a few minutes, so a copied URL won't keep working. If a link has expired, click the button again for a new one.